Friday, October 22, 2010

The Great California Continuing Slump

Despite whatever statistics you may have read this week about new weekly unemployment claims nationally, today the government released the state and local jobs data for September showing that California continues to lose jobs.

This confirmed the one meaningful weekly claims statistic reporting that as of October 2010, the number of people reported working in jobs covered by unemployment insurance in California is at the lowest so far in The Great California Slump - 1,177,076 covered jobs have disappeared from our economy since October 2008.

The most job losses during the current period (a) continue to come from the construction sector and (b) now are showing significant layoffs in the public sector. And we know this will get worse as schools, state, and local government layoffs rise.

Economists have been projecting that in the United States no "double dip" will occur in The Great Recession. That may or may not be true, but no doubt should exist that California will experience a "Continuing Slump" made up of a continuing downward trend with minor changes to the slope which can be seen from this graph (click on the graph to see a larger version):


Dictionary.com offers two definitions for the word "slump." The first is "to decrease or fall suddenly and markedly" which is what happened to California's economy in 2008-09. The second is "to decline or deteriorate" which is what happened to California's economy in 2010 and will continue to happen into 2011. But beginning in 2012 we likely will see a trend matching 2009.

I set up this blog to ruminate about a variety of important issues facing California. It was not the intent to focus almost entirely on the collapse of California's economy and the great failures of those in our State government. Unfortunately, since May 2009 42 posts here concern what I term is The Great California Slump and its corresponding national event The Great Recession (see the list at the end).

It seemed necessary to focus on California's economy because by mid-2009 it became apparent that the State would not be able to address any issues until its economy recovered.

It also became apparent in mid-2009 that even in a "non-election year" that members of the Legislature and The Gubernator were so locked into ideology and so fearful of entrenched powerful economic interests that nothing was going to be done to deal with the State's financial crisis resulting from The Great California Slump.

Finally, it also became apparent that nobody in a State political job seemed willing to describe the depth of the economic collapse, admit the likelihood that there will be no economic recovery in California before  2020, and design a course for the State government, local government, and the State's school system to prosper. And except for "other" party candidates running for office, candidates are not telling Californians what's wrong and what needs to be done with schools and state and local government beyond ideological platitudes.

Yes, a couple of columnists and a few bloggers have expressed concerns about the broad details. For instance, Sacramento Bee Columnist Dan Walters pointed out last November:  "Conservatively, then, California is probably more than $600 billion in debt."

As I noted then, the taxpayers of California are on the hook for about $48 billion a year in principle and interest payments on debt. This is a number that, relative to the General Fund angst we go through every year, is not much less than the $56 billion the State collected in Corporate and Personal Income Tax in the 2008-2009 fiscal year and is somewhat more than all the State and Local Sales Tax Revenue collected in the 2007-2008 fiscal year - $31 billion.

Now, the press is starting to report in news stories that the much-described General Fund budget deficit problem is only the tip of the iceberg. Today the San Francisco Chronicle informed us of a report from the Legislative Analyst's Office entitled California's Other Budget Deficit: The Unemployment Insurance Fund Insolvency which let's us know information about the "off the books" growing debt in the State Unemployment Fund discussed here several times beginning in May 2009, but which is now officially acknowledged in part as follows:
The UI Fund Is Currently Insolvent. The UI fund became insolvent in January 2009 and ended that year with a shortfall of $6.2 billion. Absent corrective action, the fund deficit is projected to increase to approximately $20 billion at the end of 2011 (Employment Development Department [EDD] will soon update these projections). During 2009, the state paid about $11.3 billion in benefits to workers while collecting only about $4.5 billion from employers. This recent spike in benefit costs is due to the recession, which resulted in more workers than ever applying for UI benefits.

Federal Loan Supports Benefit Payments With Interest Costs to the State. Since January 2009, EDD has been obtaining quarterly loans from the federal government to cover the UI fund deficit. These federal loans have permitted California to make payments to UI claimants without interruption. Generally, loans lasting more than one year require interest payments. The federal American Recovery and Reinvestment Act (ARRA) of 2009 provides temporary relief to states from making interest payments on UI loans through December 31, 2010. With the expiration of these ARRA provisions, EDD estimated in May 2010 that California could owe about $500 million in September 2011 and would face growing interest obligations in the out year
Of course, this is just some small part of the debt Walters was discussing.The Chronicle regurgitating the report notes:
The Democratic-controlled state Legislature enacted benefit increases in 2002 that raised the maximum weekly payment from $230 to $450 - a change they were able to make by a majority vote.

But Democrats lacked the two-thirds margin required to increase the employer contribution.

The fund became insolvent in January 2009 and ended that year with a $6.2 billion shortfall....
The report outlines the options available to the Legislature which would involve (a) decreasing benefits which the majority Democrats won't do or (b) increasing the unemployment insurance rates which the Republicans will block. But that's ok, because the federal unemployment insurance loans come with fully enforceable terms that recognize that for three decades California employers have not been paying enough into the fund. From the report:
Employers would face serious long–term consequences if the state fails to address the underlying problem that resulted in this borrowing of federal funds for the UI system. Federal law includes provisions to ensure that a state does not continue to incur loans over an extended period. Specifically, if a state has an outstanding loan balance on January 1 for two consecutive years, the full amount of the loan must be repaid before November of the second year or employers would face higher federal UI taxes. (The current 0.8 percent federal tax would increase each year in increments—starting with an increase of 0.3 percentage points—until the loan was repaid.) Once the fund reached solvency, the annual federal UI tax rate would once again drop to 0.8 percent. As shown in Figure 5, employers could face their first tax increase as early as 2012, which would result in an increased annual cost of about $325 million to employers. Absent corrective action, the federal tax would continue to increase incrementally each year to a maximum of 6.2 percent, resulting in increased employer costs of approximately $6 billion annually. We note that even this $6 billion tax increase would not be enough, at this point, to address the insolvency problem and cover the projected fund deficit. These additional federal administrative taxes are applied to the principal balance of the state’s federal UI loan.
That would, of course, make California an undesirable place in which to employ people. And since this will happen unless Congress let's us off the hook, that is a major problem which legislators are promising to fix right after they balance the 2010-11 current budget and the 2011-12 budget that begins next July. Don't hold your breath.

On the other hand, the State pension funds are discussed in great detail by the candidates for office and the public. Changes have already been approved to reduce pensions for new State employees. Everyone wants to solve this problem with the public employees. This is politically safer to address as opposed to the problem with private employers who have not paid enough into the unemployment fund for 20 years and don't want to pay enough in the next 20 years or cutting unemployment benefits for private sector employees by 40%.

It's good to address that public employee pension problem. So now we can avoid maybe having to worry about the year 2030 and focus on the years between today and 2020. You see, the Business Insider recently announced:
Here's a shocker: The most immediate state pension crises aren't in New York or California. They're in Middle America.
You see someone actually did a study. It was published by the Kellogg School of Management or Northwestern University. Someone reasonably smart (not a politician) went to a great deal of work to produce that study which discovered that if policy changes aren't made the pension funds of our many state governments will be bankrupt in the following years:
  • 2018: Illinois
  • 2019: Connecticut, Indiana, New Jersey
  • 2020: Hawaii, Louisiana, Oklahoma
  • 2022: Colorado, Kansas, Kentucky
  • 2023: Alabama, Michigan, Minnesota and Mississippi
  • 2024: Maryland, Pennsylvania, South Carolina and West Virginia
  • 2025: Missouri
  • 2026: Maine, Massachusetts and New Mexico
  • 2027: Montana and Rhode Island
  • 2028: Vermont
  • 2029: Arizona
  • 2030: Arkansas, California, Ohio, Wyoming
  • 2031: South Dakota
  • 2032: Nebraska
  • 2033: Virginia, Washington
  • 2035: Delaware, Iowa, Tennessee
  • 2036: Utah
  • 2037: Texas
  • 2038: Wisconsin
  • 2039: Oregon
  • 2041: North Dakota
  • 2043: Idaho
  • 2047: Georgia
  • Never: Alaska, Florida, Nevada, North Carolina and New York
So you have to give credit to our Gubernator and our Legislature and the candidates for state offices this year. They all agree that the important fiscal issue facing California government this year if not ten years ago is to solve that pension crisis facing us in 2030.

I can't wait until we find out whether it's going to be Former Governor Moonbeam who deserves the name or the overpaid corporate bigwig who brought us Teletubbies (no, she did not invent eBay or even make it a success). I'm sure either can find music entertaining their particular audiences to play on the Gubernatorial fiddle while California continues its slumping.
__________________________
Here are links to the previous 42 posts on The Great California Slump and The Great Recession:

Saturday, October 9, 2010

Californians Committing Fraud Because We Must?


I'm not intending to pick on the Gubernator (my preferred spelling) as everyone who participated in the compromised budget (yes, I meant compromised) approved this week accepts this, but from the LA Times here's how our State leaders think:
Administration officials said many of the cuts announced Friday would be made in ways intended to minimize the effect on people who rely on state services. A $366-million cut to CalWORKS, for example, will be covered by an advance from the federal government that the state hopes it will not be required to pay back, said Ana Matosantos, Schwarzenegger's finance director.
In other words, the proposal would be termed "fraudulent" except that terms means "having the intent to deceive." In fact, these folks know they aren't deceiving anyone. If  what you're doing is taking money under false pretenses, do you really want to tell the press. Apparently so.

What's depressing is that it completely reflects how the Legislature "closed the deficit." Even if the deficit number itself was not the fraud it is, the budget process was.

I suppose it isn't like these "leaders" had a choice. If they hadn't found the votes the State soon would run out of money. With no budget, its ability to borrow would be severely crippled. The California Constitution says the budget was to be adopted June 15. But hey, that deadline has been met only five times in the last 30 years. So the simple fact that this is the longest the State has gone in a fiscal year without a budget isn't what made them act. The likelihood of running out of cash was the driving force.

Below is a screenshot from the document they presented before the voting:


The "Starting Problem" of a $17.9 billion deficit is a fraudulent number. The real number is more like double that figure. But even if we accept it, the problems buried in the other numbers are beyond imagination. Well, apparently not beyond imagination, as somebody has imagined this.

The silliest one is the "Federal Funds" item - $5.3 billion which is double any real possibility. The Sacramento Bee reporter who attended the presentation noted:
Presentation notes, in italics, "Still more work to do in Washington."
Yeah, right.

Expenditure reductions include interesting things such as reducing prison inmate medical costs by $820 million, a function completely controlled by a federal receiver because the State wasn't spending enough. The federal receiver must be shaking his head in wonderment.

The additional revenue portion of the document says:
More that half of this, $1.4 billion, is from the Legislative Analyst’s revenue forecast, which was $1.4 billion higher than the Governor’s May Revision – three months into the fiscal year, this additional revenue has already been realized.
That would be fine if it were a true number. But reality is that the Legislative Analyst in May predicted that revenue from income, sales and corporate taxes would come in $1.4 billion higher for the entire fiscal year of 2010-11.

In fact, the Controller has not publicly issued revenue numbers for September, but for the first two months sales tax data indicates a stagnate economy at best. Corporation tax revenues were down and Personal Income Tax Revenues year-over-year were flat.

Like last year only more so, much shifting of funds and delays in making payments is buried in the budget. More school districts this year will be borrowing against promised but delayed state revenue owed to them. Money will be wasted on interest. And in some cases, the state is nearly five years behind in payments owed to schools.

Presumably in January 2011 a new Governor and new Legislature immediately will face making revisions in this budget and trying to figure out how to deal with an even worse situation for 2011-12 without committing fraud.

Good luck with that my fellow Californians.

Friday, August 20, 2010

The sky is falling; California might have to pay with IOU's...again.

As federal and state regulators shut down four banks Friday, the State of California is not looking so good either.

This week the California Supreme Court allowed the Gubernator to order 144,000 state workers to take three days of unpaid furloughs each month. State Controller John Chiang said that the state is running out of cash and might begin issuing IOUs within two weeks because the Legislature has not adopted a budget for the fiscal year that began July 1.


"I must be clear that this year's looming cash crisis is fundamentally different than last year's," Chiang explained in aa speech Wednesday. "Importantly, the fiscal crisis we face this year is 100 percent political, and the only thing standing in our way is the absence of leadership."

Uh, someone should have commented it's always been political, John. We have a mostly inexperienced Legislature because of voter mandated term limits and the voters mandated a two-thirds vote in both the Senate and Assembly to approve a budget knowing the Republicans would likely always hold slightly more than a third of the seats in each house. It's an election year. It's politics. We don't have a State budget and we probably won't have one until after November.

That's the situation in Sacramento. Meanwhile, back in reality the federal survey data for July came in and according to it, we lost 25,102 jobs and added 89,916 to the workforce showing a "seasonally unadjusted" unemployment rate of 12.8%. During the four weeks of July, the Employment Development Department reported that 314,142 initial unemployment claims were filed compared to the 155,188 filed during the same four weeks in 2006.

Looking at the actual number of people who have jobs as indicated by the federal survey and the EDD report, we can establish that the job loss since the 3rd quarter of 2008 looks something like this and we can project a trend (click on the graph to see a larger version):


Unfortunately, the state's economy has bottomed out which means State General Fund revenue hasn't bottomed out.

It appears we will have lost 1.3 million jobs by June 2011 resulting in further loss of income and sales tax revenue. So what on Earth makes anyone think they can project a budget that doesn't involve "slash and burn" cuts to schools, welfare, and health care and significant tax increases?

Or is the plan just to sit back and run out of money? Like we have in prior years.

Wednesday, August 18, 2010

Taxing the "rich" and "not-rich"

The airwaves and blogosphere are filled with a deluge opinion flowing around the expiration of "The Bush Tax Cuts for the Rich." Either we need that tax money to reduce the deficit or we need the rich to keep the money so their investments will help the economy will recover. We are assured the sky will fall if the tax code returns to the way it was in the 1990's.

The debate around this subject seemed too much like specious campaign rhetoric to ignore. Most certainly, how the federal income tax is structured will be of importance to everyone. But what are the facts underlying this rhetoric? And if there is a problem, how would I solve it?

The Expiring Tax Policies

Of course, the facts are very different from the debate. A number of elements are involved in the tax code changes that expire December 31, 2010. The most obvious involves the rate tables published in the press and online as follows:

Table 1
If the rate tables in Table 1 by themselves don't confuse you, nothing will and you don't need any help with the issue. Since income steps are not the same on each table, I don't know how you could not be confused.

Beyond the differences in income steps between plans, the "taxable income" brackets shown are not your income. Even if all your income is taxed normally (for instance you don't get any capital gains tax breaks), at a minimum you can take the standard deduction and get the per person exemptions. The total of those on your return represent tax free income as follows (ignore the "My Plan" line, we'll deal with that later):

Table 2
Ok, so the confusing tax rates in Table 1 aren't applied until the income shown in Table 2 is deducted. Then, if you add in the fact that there is a Child Tax Credit which you can deduct from the taxes you owe but which will drop from $1,000 per child to $500 per child if the 2011 plan goes into effect, things get even more confusing.

I had to spend time with a spreadsheet to do a little comparison. I assumed certain levels of taxed income, which is gross income less all those deductions, adjustments and exemptions and I ignored the many special rules that apply to some people. I then determined the tax due and deducted the applicable "Child Tax Credit." I discovered this (again ignore "My Plan" which will be discussed below):

Table 3
If the "Bush tax cuts" 2010 Plan expire at the end of this year, the effective tax rate for a couple who are taxed on $1,000,000 of annual income will jump from 32% to 36% and the rate applied on more taxable income above that will be 39.6%. On the other hand, a couple with two children who are taxed on $20,000 of annual income will see their effective tax rate jump from 0.8% to 10.0%, something not regularly pointed out in the noise in the press and on the web!

Let's deal with the truth here. No one is going to be convinced that the loss to taxes of $153 a month would not be a problem for a couple trying to support two kids on $3,875 a month (remember one must add $26,000 in standard deduction and exemptions to that $20,000 taxed income). And I doubt that one is going to be convinced that a family taxed on $85,500 a month (yes, I know they would have had itemized deductions far in excess of the standard deduction, but this is just an example) would suffer from the loss to taxes of $3,285 a month.

There is a dilemma facing Congress. Simply allowing the "Bush Tax Cuts" to expire is not the best policy option, nor is it even rational, as it would:
  • increase the rate structure in a recession,
  • reduce the Child Tax Credit by $500, and
  • restore the marriage penalty.
On the other hand, it would be nearly impossible to get enough votes to adopt the Obama plan because of the reluctance to let the tax rate increase on the wealthy. "My Plan" would be politically feasible.

My Plan

"My Plan" would be to let the old rate table return and let the extra $500 child tax credit go away. In other words, let the "Bush Tax Cuts" expire.

Instead of arguing over those rate policies, let's triple the exemption for the filer (the "Yourself" box on the 1040 form) from $3,650 to $10,950, double the exemption per additional person ("Spouse" and dependents) from $3,650 to $7,300, and index that credit to the CPI for the future, a policy that has been needed for years.

Yes, "My Plan" would increase the tax due from $14 a month to $22 a month on the lower income family with two kids. But keep in mind that they have to earn more than $51,550 a year to have any taxed income. It seems like $8 a month is a reasonable amount to collect from such a family to help pay for the wars in Afghanistan and Iraq. The family of four taxed on $1,000,000 would have to pay an increase of $2,683 a month.

"My Plan" would, however, actually drop the taxes paid by the hurting middle-class taxpayer who pays taxes on about $60,000 a year (again that family of four must earn more than $51,550 a year to have any taxed income, so we're talking about a family that makes $111,550 a year). This economic group would gain $150 to $180 a month to spend or save beginning in 2011. Likely they will spend at least two-thirds of that gain. Increased spending will boost our economy.

Every member of Congress should be able to vote in favor of it, unlike requiring a vote on a new tax table. What's not to vote for, since the option of doing nothing will represent higher taxes. Well, yes, we do have the deficit and economy problems. Fortunately "My Plan" has a second part to do more than stimulate increased consumer spending.

My Plan Part 2: Tax Credits

If we want to use tax policy to deal with the American economy, deficit,  and that high tax rate on those with higher incomes, let's consider instituting three tax credits:
  1. Institute for businesses an Investment Tax Credit for tax years 2011 and 2012 with a carry over of unused credits into 2013 and 2014, up to a maximum total of $120,000, and only on purchases of new business equipment and rolling stock manufactured in the United States.
  2. Institute for businesses an Employee Expansion Tax Credit for tax years 2011, 2012, and 2013 equal to the amount paid on the employers' share of Social Security (FICA) on jobs newly created and continuously filled for more than six months (compared to the September 2010 reported positions).
  3. Institute for businesses and individuals a Newly Constructed Building Purchase Tax Credit  for tax years 2011 and 2012 of $5,000, allowable on purchases of residential and commercial buildings constructed during the period of 2008-2011.
We are constantly hearing from the right that those with the higher incomes invest in our economy and increasing the upper bracket tax rate by 4.6% will discourage investment. If those paying taxes in the highest income tax bracket are providing capital for investment in the American economy, they will be the beneficiaries of all three credits as they are passed through to investors. If they aren't actually investing in the American economy, they'll just have to forgo what most Americans would think are luxuries.

Even workers will benefit from the jobs created as a result of these credits and some will benefit from the Newly Constructed Building Purchase Tax Credit on homes they purchase.

On the other hand, the tax credits do represent a loss of tax income which increases the deficit. However, the right would argue that in the long term they will produce more economic activity which would result in increased tax income which would reduce the deficit.

 Growing Our Economy

While I believe my proposals would speed up our economic recovery, that would only be in the short term. As I've posted before, Americans will still need to address what they expect out of their economy.

Between outsourcing and automation we have used our American ingenuity and initiative to put ourselves out of work. We need to find a way to use all our human energy - mental and physical - to create wealth that returns back to each of us to meet our material needs - not just basic needs but a level of "middle-classness" needs, whatever that means.

The economic model of the second half of the 20th Century isn't going to work in the future in my opinion. Being constantly at war from 1947 to today isn't a sustainable pattern to follow. Relying unnecessarily on other nations' natural and human resources is foolishness. Allowing a few to divide our energies into squabbles over meaningless economic and social ideologies just diverts attention away from problem solving.

If my granddaughters are to be assured that the energetic use of their skills and talents will give them that middle class economic status that I "enjoyed," Americans must be even more socially aware, economically innovative, collectively creative, and individually adaptable during the next 60 years than we were from 1947 to 2007.

That shouldn't be a problem for Americans as we transition from the Information Age to whatever "Age" the future brings. Right?

Saturday, July 31, 2010

What do you want from the American economy?

What do you want from the American economy over the next two decades?

Last October in What's the purpose of an "economy" two contrasting definitions of an "economy" were offered:
At Dictionary.com we learn that we can describe an economy as "the management of the resources of a community, country, etc., esp. with a view to its productivity."

On the other hand the folks at Wikipedia [until the middle of December 2009] offered a different definition: "an economy is the ways in which people use their environment to meet their material needs."
The difference between these two descriptions is informative. One is about people meeting their material needs - having food, clothing, shelter, medicine, and other "stuff ." The other could be about computers and robots using material resources to increase something called "productivity." Do you ever wonder what purpose our economic growth has served?

Distribution of economic growth since WWII

Here is a chart that reflects the outcome of our economy over the last 63 years (click on the chart to see a larger version):
Chart 1


The chart graphically displays:
  • Personal income adjusted for the Consumer Price Index has continued to rise;
  • Investment income (dividends and interest) as a percentage share of that income has grown substantially;
  • Wage and benefit income as a percentage of that income has shrunk.
Let's take a look at another chart covering the last 63 years (again, click on the chart to see a larger version):
Chart 2


This chart graphically illustrates the U.S. economic productivity growth and growth rates of personal income by source. Looking at the period from just after World War II until mid-2010, the Gross Domestic Product after adjusting for inflation and population growth grew 186%. We find that during the same period personal income grew 209%.

One cannot help but notice with concern that wage and salary income has grown only 147% and, more alarming, business proprietors' income - usually small businesses that are single proprietor or partnerships -which has grown only 33%.

Those percentages are in sharp contrast to dividend and interest income has grown 565%, nearly four times that of wage and salary income and nearly 16 times that of proprietor income, confirming what was evident in the first chart, that the post-WWII economic growth pattern benefited:
  • Investor income three times the actual economic growth rate;
  • Worker-income 20% less than the economic growth rate
  • Small business owner income 80% less than the economic growth rate; and
  • Landlord (both residential and commercial) income ...well... it appears to have been a roller-coaster ride that ends at a point 50% less than the economic growth rate.
Using this information, what can one conclude was the purpose of our economy?

It would appear that the purpose of the American economy for the past 60 years has been to improve the return on money invested in corporations and financial institutions. That necessarily has resulted in a lesser share of income from growth for labor whether that labor was done by employees or by proprietors and partners.

Again, let's take a look at another chart covering the last 63 years (click on the chart to see a bigger version):
Chart 3


From 1947 to today, for each dividend and interest dollar paid to American investors, the amount paid for labor in America dropped from about $9.50 to $4.00.

Before proceeding, two things should be made clear. This is not about "Socialism" which at its core means state ownership of the real estate, machinery, and other means of production. This is not about the recent term "Ownership Society" which is a political slogan meaning different things to different people (but for advocates has generally meant the beginning point of an argument for the reduction in income transfers from the more affluent to the poor imposed by the government).

This post is not about socialism nor the politics of poverty. It is about a long-term economic trend in income distribution from what we like to refer to as our "mixed economy."

Remember the two definitions/descriptions of an "economy" at the beginning of this post? One is about people meeting their material needs. The other could be about computers and robots using resources to increase something called "productivity."

We seem to be doing very well at implementing using resources through automation with the result being increased productivity.

How well have we done in this country if we define "material needs" at its minimum? "Needs" after all means "what is required, necessities." Relative to other developed nations, we do poorly at making certain all our people have access to what is required to maintain a life free of need, meaning a minimum standard of living. We try, but particularly now, in The Great Recession, we're plagued with more homelessness and inadequate health care and we do have more than a few children who do not get "three square meals" a day.

But when Americans talk about the economy, we use a traditional American viewpoint regarding standard of living. When we discuss our needs - "what is required" - we really mean that which is needed to maintain a "middle class" lifestyle. The problem is, nobody seems to clearly know what that is.

What is the "Economic Middle Class"

We think we know what the "economic lower class" is (keep in mind these are not pejorative terms demeaning people, but terms related to income and assets owned). The government defines "poverty level" income for a family of three (usually with one wage earner) as $18,310, though the unspoken assumption (sometimes not true) is that this family would receive in "income transfer payments" in the form of medicaid, food stamps, and a housing subsidy plus training and other assistance to make them more employable.

Then we all need to know who is in the "upper class." Probably the best definition uses the personal net assets level to define the "economic upper class." The Generation-Skipping Transfer Tax Exemption is set at $2 million, a figure which was also the Estate Tax Exemption from 2006 to 2008. If the members of a "nuclear family" have $2 million in net assets (assets less liabilities), by American government standards they are in the economic upper class.

It seems therefore that the American "economic middle class" is a vast number of people who find themselves outside what the government defines as the economic lower class (whew!) and the economic upper class (darned!).

But defining the "economic middle class" this way is very confusing as there are substantial variations in the "lifestyles" within this group of American. Is there one guideline Americans have used as an indicator of "middle-classness?" Probably having sufficient income to buy a home is an indicator of achievement to middle class. (Home ownership itself is not an indicator, just having sufficient income to buy a home if one wishes to do so is the indicator that a family has achieved the shared American dream.)

According to the California Association of Realtors, in the first quarter of 2007 the minimum household income needed to purchase an entry-level home in California was $96,910. By the third quarter of 2009 - after the housing price bubble burst leading to The Great Recession - the minimum income needed to buy an entry-level home in California was $43,500.

There seems to be a huge difference between these numbers. Do you need to earn $97,000 a year or $43,500 a year to reach achievement to middle class? The home price bubble really did a number on "middleclassness" in California and in many urban areas across the nation during the last decade. Fortunately, in much of the nation the numbers averaged half the California numbers from 1990 - 2007.

If we assume that in 2010 a wage-based income of around $45,000 a year is the indicator of arrival to middle class, then what about those with incomes between $18,310±($9/hr) and $45,000± ($22/hour). Historically this group would have been called the "working class" and "blue collar workers." Also historically, people above this level were proprietors (business owners) and professionals (attorneys, doctors, etc.), people who invested in, and owned the assets of, their businesses and were more likely to be called the middle class.

As we have seen in Chart 2 above, "proprietors" who own their businesses have become fewer and likely are seeing less personal income. In fact, during the past 60 years more of these Americans have become employees in medical groups like Kaiser or a corporate attorney or a manager of a business division of a large corporations. They don't own their business.

One confusion about the middle class here in the beginning of the 21st Century is identity. Employment including such diverse groups as academics and teachers, social workers, engineers, managers, doctors, nurses, pharmacists, and attorneys have been defined as "professional-managerial class." Barbara and John Ehrenreich formally described this group as "salaried mental workers who do not own the means of production and whose major function in the social division of labor...(is)...the reproduction of capitalist culture and capitalist class relations."

Though self-described as "middle class," those in the professional-managerial class tend to seek higher rank status and have higher incomes than average for factory, clerical and service workers. In the latter part of the 20th Century members of the professional-managerial class came to identify themselves with those in families whose income derives primarily from dividends and interest.

Thus, by the early 21st Century these mostly college-educated workers erroneously identified their interests with the interests of the economic upper class. This may have happened because in their nuclear families, through the advent of having two wage earners in the household and access to essentially unlimited debt, many of them acquired gross assets valued in excess of $1 million, though the asset value was inflated by the housing bubble, their net assets were well below that number, and their income derived mostly from work.

Dreams notwithstanding, if (a) you must earn wages or a salary to maintain your standard of living, (b) your income exceeds $20,000±, and (c) your assets minus debts total less than $2 million, you are in the working middle class whether you are a single parent family with an income of $30,000 a year living in a rental or a single child working couple with a family income of $110,000 a year living in your owned home. Today the vast majority of Americans who are working are in the middle class.

The median weekly earnings for full time employment is $740 a week or $38,480 a year or $18.50 per hour which means that most of single person or single parent American middle class families could not feel like they've achieved "middle-classness," meaning they could not buy a home if they wished to do so.

As a subgroup the median weekly earnings for full time employment for those in the professional-managerial class is $1,050 a week, $54,600 a year, or $26.25 an hour. As a subgroup, single person or single parent professional-managerial class families need only one person employed to feel like they've achieved "middle-classness" meaning they could buy a home (though not in California in during the mid-2000's where two such incomes were required).

We've explored the idea of "middle-classness." Let's return now to the economy.

Returning to business as usual

According to Treasury Secretary Timothy Geithner in an August 2nd New York Times op-ed piece the economy is returning, even if it is doing so slowly. He lists a number of things that indicate a basis for optimism to him and other financial types including:
• Exports are booming because American companies are very competitive and lead the world in many high-tech industries.

• Private job growth has returned — not as fast as we would like, but at an earlier stage of this recovery than in the last two recoveries. Manufacturing has generated 136,000 new jobs in the past six months.

• Businesses have repaired their balance sheets and are now in a strong financial position to reinvest and grow.

• The auto industry is coming back, and the Big Three — Chrysler, Ford and General Motors — are now leaner, generating profits despite lower annual sales.
The problem with this list is that it does represent a return to the economy that began with second half of the 20th Century. No one has bothered to ask the question "Is this what our economy is supposed to do?" Let's take these items one at a time and examine them from an American middle class viewpoint.

High-tech Industry Exports. As explained here last October in the post The iPad Economy we see growth in our GDP when Apple sells iPads to customers in Germany. The product is manufactured in China a shipped to Germany and Apple shareholders will make money. From that economic activity, few American workers will benefit, limited mostly to those in the "professional-managerial class"though a small number of support, clerical and janitorial folks will see continued employment.

But this technological export growth will not produce in the United States any manufacturing jobs and probably no other new jobs.

Private Job Growth. My reaction was "you've got to be kidding." According to recent statistics from the government that employs Geithner, so far during The Great Recession the U.S. lost about 7.3 million jobs while the workforce grew 0.7 million. We need 8 million jobs just to rebuild our economy where it was in November 2007. Any growth in recent months is negligible, barely keeping pace with the current growth in the workforce.

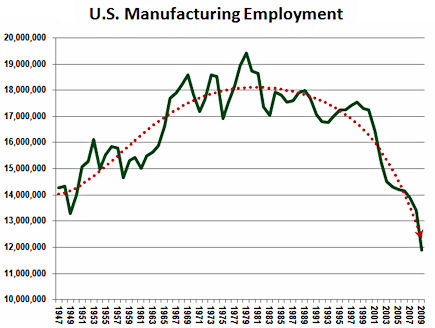
Then, particularly since he is a member of a Democratic Administration, one has to wonder under what rock Geithner has been living during recent decades that he would mention "manufacturing jobs." Since 1977 - 32 years ago - the United States has lost 7.5 million manufacturing jobs - yes, nearly 2 million of those were among the 8 million jobs lost in The Great Recession. But without a substantive change in dominant attitude among the financial gurus and those in the upper-most tier of the managerial class, we're not going to see even those 2 million manufacturing jobs come back in the next decade. This is a graph of our manufacturing employment since 1947:
Chart 4

Manufacturing jobs, really? Even if manufacturing employment in America could recover to 2007 next year, we'd still be short 6 million jobs. But where are these manufacturing jobs going to come from? Green industry? Which brings us to his next item.

New Investment Resulting from Repaired Business Balance Sheets. Which businesses? Big international corporations like GE are using the asset accumulation in the balance sheet to pay dividends to their shareholders and buy back their own stock in order to increase the stock value. We'll explore this asset use later in this post, but GE is a major manufacturer of alternative energy systems.

Large retailers? Are they planning new investment? Most retail sales depend entirely on American worker income. Costco, Home Depot, Walmart and Safeway all are ready to invest? In what? New stores???

High tech manufacturing? Yeah, a new plant opened in Taiwan to manufacture new iPads.

For a even clearer picture, let's move on to the next item.

The American Auto Industry Rebound. That the American auto industry is showing a rebound is true. Ford is the best example. Last month it reported a $2.6 billion second quarter profit, which is nearly 70% of it highest profits ever in 1999. It is doing it with half the employees it had back then.

General Motors. You remember them. The government bail-out left the taxpayers owning 60% of GM. It appears GM is going to be making a pile of money - in China. GM sells more cars in China than it does in the U.S. and produces them there. It employs 32,000 hourly workers in China and 52,000 in the United States. It employed 470,000 here in 1970.

And, if you're among the corporate professional-managerial class, such as an engineer on the electrical system in the Volt, you need to be aware that GM in China is building a $250 million advanced technology center to develop batteries and alternative energy sources (that green industry the President is suggesting might put Americans to work). Maybe we can still buy a 2021 Chevy Volt assembled here by robots, but the improved batteries in that year's model will have been developed and probably manufactured in China, by Chinese engineers and Chinese workers.

Fortunately, the American taxpayer will share in the profits if GM succeeds in China. Of course if you have been unemployed or are making half what you made in 2006, you won't share much. But those who depend on dividends and interest for income likely will see some benefit from those profits if only in the form of lower income taxes.

To repeat a previous paragraph: From 1947 to today, for each dividend and interest dollar paid to Americans, the amount paid for labor in America dropped from about $9.50 to $4.00. Is this the desired purpose of an economy?

What do we want from our economy?

What do you as an American want from the American economy? As indicated in Chart 3, at the beginning of 1952 ten dollars ($10.00) was paid to Americans in wages and benefits for each dollar of interest and dividends paid to Americans. By 2006 that number had dropped to four dollars ($4.00) where it has hovered since.

For nearly 60 years, we have rewarded capital investment with a larger share of income from economic growth than the share we rewarded labor. If the trend for American capital to invest in automation and in industrial/technological production in foreign nations continues, this shift in reward pattern will continue. If these trends continue, wages and benefits paid to Americans workers for each dollar of interest and dividends paid to American investors will drop to $1.60 by the end of the Century.

This investment pattern is not inherently bad. But do we want to see the same pattern of reward from American economic growth in the next few decades? Will that pattern depress the American retail and service economy further? Could it create a difference in classes similar to that seen in Third World countries today?

Maybe its all a perfectly acceptable pattern. But if not, the question is how to reconcile this investment pattern with a goal of maintaining both a minimum middle-class standard of living for the poorest among our population and a middle-class homeowner standard of living for most of our population.

One thing is for certain. No problem will arise in increasing the share for the American investor whose income comes wholly from interest and dividends.

Geithner in his Times piece concludes:
And as the president said last week, no one should bet against the American worker, American business and American ingenuity.

We suffered a terrible blow, but we are coming back.
What he and the rest of the financial community need to address is the fact that no one ever bet against the American worker, American business, and American ingenuity. It is simply a fact that like the auto industry, international corporations headquartered in America using typical American ingenuity are just choosing not to bet on the American worker at this time, but rather on automation and markets in other nations.

Ford is already a winner using automation, which makes a very large number of potential American auto workers not winners. GM is already a winner in China using Chinese workers and intends to be a winner there in alternative energy using Chinese workers.

The second quarter profit reports indicate that the 500 largest non-financial firms, after watching profits plummet in The Great Recession, have recovered to nearly 90% of pre-recession levels. Their managers are sitting on about a trillion dollars.

The managers know that profit growth is coming from their overseas operations where they are expanding. They know that future profit growth from U.S. operations will come from investment in automation. And they know it is in their best interest to use some of that cash to pay higher dividends and buy back shares to buttress increased share prices until that new investment in automation and in overseas operations pays off.

That's why in a July 23rd article we read:
General Electric Co., emerging from the global recession with a hoard of cash, raised its quarterly dividend by 20 percent and will resume stock buybacks sooner than it had predicted. The shares rose.

GE said in a statement it raised the per-share payout to 12 cents a quarter from 10 cents. The company extended stock repurchases through 2013 from the end of this year, and plans to begin buying shares this quarter.

Chief Executive Officer Jeffrey Immelt is scaling back some of the cash-saving steps he adopted in 2008 as the financial crisis deepened. GE said July 16 that it expects to have $25 billion in cash at the parent company level by year-end.

“We are able to restore the GE dividend at a historical payout level for 2010 earlier than previously anticipated and to extend our share buyback program because of continued strong cash generation, recovery at GE Capital, and solid underlying performance in our industrial businesses through the first half of 2010,” Immelt said in the statement.
The Friday prior to the announcement, GE shares closed at $14.55. The price of GE shares rose steadily from then on. Ten days later they closed 13% higher at $16.48.

Not that these companies won't start hiring American workers. They just won't be replacing the 2 million jobs lost in The Great Recession any time soon. Now would be a good time to examine economic growth reward patterns in order to make adjustments for the next 60 years.

Perhaps we'll need to find a way for all members of the American middle class to receive a larger share of the dividend and interest income from economic growth without having to risk their kids' college education, their own future retirement income, and their homes in the process.

Monday, July 19, 2010

The Bear Bones Era Take 2: "Stupid is as stupid does" - Forrest Gump


In January the pun "Bear Bones Era" was introduced here to describe the state of the State of California. The Gubernator in his annual State of the State Message had just offered up his depressing budget recommendation for the fiscal year running from July 2010 through June 2011.

Since then the Legislative Analyst also has offered revenue projections for 2010-11 that are somewhat more optimistic by about $1.4 billion. Building on that, a committee in the State Senate and a committee in the State Assembly each prepared a draft budget reflecting different ways of "optimizing" available cash to support spending programs.

Californians have yet to face the fact that the cash truly available is at the bare bones level meaning "the irreducible minimum; the most essential components." Existing proposals in the Legislature to spend cash are not at the most essential components and by any rational standard are not at the irreducible minimum.

Now we have in Assembly Speaker John A. Pérez, the voters' perfect legislator. Pérez was first elected to the Assembly in 2008, his first job in State and local politics. So, reelected in 2010 and having that really significant two years of experience - ironically more than many of the newly elected Assembly members filling seats where incumbents have been termed out by voter mandate - the Assembly Democrats elected him Speaker.

Favoring the "Progressive" point of view, his budget game plan relies on more taxes and borrowing, and limited cuts to schools and social services. He has strong support from the state's most powerful labor unions. And he shares their ignorance of reality, so has no problem pressuring Senate President Pro Tem Darrell Steinberg whose first goal is to find a way to adopt a budget that works.

Steinberg has a real disadvantage. He has the knowledge gained from experience - as a Sacramento City Council member (1992-1998), an Assembly member (1998-2004), and the Senate (2006-current). He appears to know there is a real problem.

So in the Assembly, we have a leader adhering to the "Progressive" point of view and a Republican block larger than one-third adhering to a rigid "no new taxes or tax increases" point of view. It's the perfect storm of voter accomplishment - a two-thirds requirement for budget adoption and a room full of legislators with no experience representing ideologically firm to mostly ignorant constituencies.

This situation is exacerbated by "hope," mostly the optimistic belief that the underlying economy will improve substantially within a year or two. This causes many to believe that if we can just find some money to borrow to be paid back in ...say... 2015, it will all work out.

In other words, the prevailing mantra is "let's just all ignore the fact that no reason exists to believe that the economy will improve significantly before 2015." California needs to acknowledge we are in a "Bear Bones Era", the first since the 1930's. And by "era" I mean at least a decade.

We needed a "statewide reality check" last year, before the State Budget was adopted. The situation is even more critical now.


The "Cash Flow In" Reality

The starting point is that total cash flowing in to support governmental functions including education will be near the 2004-05 fiscal year level as can be seen on this graph (as with many graphics here, click on it to see a full size version) which includes cash in from temporary and permanent sales and income tax increases plus increased withholding tables, all adopted since 2004-05:


You won't see a graph elsewhere that includes half of the statewide revenue from the 1% property tax rate (set by Proposition 13). The fact is that the State must fund K-12 which means making up the difference between spending and property tax revenue received by the schools.

According to the August 2006 State Board of Equalization publication California Property Tax: An Overview:

The property tax raised more than $43.2 billion for local government during 2006-07. These funds were allocated as follows: counties 17 percent, cities 11 percent, schools (school districts and community colleges) 53 percent, and special districts 19 percent.

It is obvious that changes in property tax revenue are just as important to the State budget as changes in sales tax revenue. A downward change in the trend of property tax revenue has occurred that will impact school funding for at least three fiscal years - the year just completed, 2009-10; the current fiscal year, 2010-11; and the 2011-12 fiscal year.

The average increase in the assessed value, and the corresponding revenue from 1% property tax rate, in the period beginning July 2000 and ending June 2009 was 8.6% a year. In fiscal year 2009-10, the assessed value statewide dropped 2.4%, it likely will drop another 3±% in 2010-11, and (my estimate) drop by 2±% in 2011-12. California has not seen a graph that looks like this since the 1930's:

Any income, sales, or property tax revenue increases of any significance are just not going to happen in the next decade because "it's the economy, stupid," to use a phrase from Clinton's 1992 election campaign.


The Underlying Reality: Our Economy


The second basic reality check is the economy within California. No "recovery" from The Great California Slump will occur any time soon.

First, Californians and their economic experts must acknowledge that it does not matter how well multinational corporations are doing - if that corporate "economy" has begun a recovery, that's nice but nearly irrelevant. Economists point to growth in the world and U.S. economy based on revenue growth reported by multinational corporations. In the U.S. those numbers are included in the Gross Domestic Product (GDP).

But almost no Californian lives for free in a home owned by such a corporation, eats meals prepared daily in that home by employees of such a corporation, dresses in clothing provided by such a corporation, and a large number don't receive health care provided by such a corporation.

The success of an "economy" must be measured in terms of the number of people it benefits through jobs, as argued here previously.

The only important economic question is: "How many Californians are earning from jobs?" The graph below shows 35 years of data - the size of the workforce and the number of jobs in California. Click on the graph to examine a full size version.


The red line indicates that despite fluctuations from month-to-month and year-to-year, the growth of the workforce in our state continues at a fairly predictable, consistent level. The green line shows that beginning in late 2007 the number of jobs plunged to near the level it was in 2000 (purple line).

Simply, the entire decade from 2000-2009 was a private sector jobs-creation zero for California, though many California-based multinational corporations have grown revenue beyond imagination. As I noted previously, this was the first "Lost Decade" of the 21st Century for California's economy. No reason exists for the next decade to be any different (except possibly for the lack of an artificially created employment bubble). Having lost over a million jobs (with more to come as government pares down), there is no reason to believe that income tax and sales tax revenue will increase at any significant rate over the next ten years, if at all.

Property tax revenue will not increase either. As noted above during the period beginning July 2000 and ending June 2009 property tax revenue 8.6% a year and has now begun a decline because of the home price bubble crash. Although more stable than the other tax bases, it has begun a slow decline because of the following:


And while there was a slight increase from 2009 to 2010, the expiration of the federal new home buyer tax credit resulted in a 2.9 percent drop in the median price in June as new home sales plummeted a record 32.7%, largest drop the since the government began collecting such data in 1963.

While it is reasonable to discuss the idea that California has a revenue problem because of declining bases - declining personal income, declining taxable sales, declining home prices - it isn't likely that the voters will allow any revenue rate increases in the near future. This is particularly true with regard to property tax revenue controlled by Proposition 13. Property taxes should be adjusted upward. Which brings us to the crux of California's problem - the voters have mandated costs well beyond the State's revenues. Voter mandated expenditures far exceed what the voters are willing to pay. This isn't surprising as overall voter personal expenditures exceeded what they made in recent decades. Deficit spending is a Californian's way of life but apparently we don't understand that our State and local governments cannot join us, unlike the federal government.


The "Cash Flow Out" Reality - Voter Overspending

California voters have been involved in school funding (Proposition 98 - California Mandatory Education Spending), our prison system (the Three Strikes Law), and a whole host of bond acts, some of which are listed below along with measures to fund anything which were voted down:

ELECTION MEASURE NUMBER TITLE Passed/ Failed


EDUCATION SPENDING
1988G 98 California Mandatory Education Spending P
1998G 1A Public Education Facilities Bond P
2000G 39 School Facilities Bonds P
2002G 49 After School Programs P
2004P 55 Public Education Facilities Bond Act P
2006G 88 $50 per parcel property tax; provides public school funding for K-12 F


PRISON SPENDING

1994G 184 Sentencing Repeat Offenders P
1994G 189 Denial of Bail; Felony Sexual Assault P
1996P 195 Punishment with Special Circumstances P
1996P 196 Punishment for Murder P
1996G 205 Funding for Incarceration Facilities F
1998P 222 Murder - Punishment P
2000P 18 Murder; Punishment P


BONDS TO BE FUNDED FROM GENERAL FUND
1996P 192 Seismic Retrofit Bond Act of 1996 P
1996G 204 Water Bond P
2000P 12 Park Bond P
2000P 14 Library Bond P
2002P 40 Clean Water and Parks Bond P
2002G 46 Housing Bond P
2004P 57 Economic Recovery Bond Act P
2006G 1C $2.85 billion bond for low-income housing and shelters P
2006G 1E $4 billion bond for levee improvements and flood control P
2006G 84 $5 billion bond for safe drinking water, flood protection and park improvements P
2008G 3 Children’s Hospital Bond Act. Grant Program P
2008G 1A Safe, Reliable High-Speed Passenger Train Bond Act P


MEASURES FOR FUNDING
1996G 217 Top Income Tax Brackets F
2004P 56 State Budget, Taxes, & Reserve F

In fiscal year 2001-2002 the effects of the "Dot-com" bubble bursting were seen in the revenue decline of the State, but actual expenditures were almost in line with revenue that year. Since then the Legislature has been blamed by an thoroughly ignorant press for all the subsequent deficits.

In fact, the voters are directly responsible for the spending mess of the State government since 2001-2002. In the three areas where the voters have assumed responsibility for micromanagement, by 2007-08 spending exceeded reasonable increases to keep pace with inflation and population growth by a whopping $33.8 billion. In the remaining areas controlled only by the legislature, increase have been kept under inflation and population growth by $3.6 billion. The chart below lays this out (click on the chart to see a large version):


This year the only real option regarding expenses is to roll back expenditures to near 2004-2005 levels, particularly the Department of Corrections which went up 44% between 2004-05 and 2007-08 and local schools (K-14) which went up 30% in the same period. This would require the voters of California to give up trying to micromanage the criminal justice system with such things a the Three Strikes Law and mandating annual school system funding increases.

The something-for-nothing-mentality that has plagued California government because of voter attitude must stop. The only honest balanced budget for the current fiscal year 2010-11 would be as suggested below.*


The problem, of course, is that such a budget would violate two voter spending mandates, one for local schools and one to overcrowd prisons and jails. At some point after 1970, governing this State became impossible. Some drastic action must be taken to resolve the problem. Continuing to act in a stupid manner just makes us a stupid people. Or as Forrest Gump said: "Stupid is as stupid does."

My solution is to divide the State into three states - see Three Californias.

__________________________

*Unfortunately, voter approved General Obligation Bond issues require that payments continue to increase and the increase in All General Fund Other State Operations includes the State absorbing into its budget the cost of local courts a few years ago as well as unavoidable costs for supplies and services from the private sector. Also, the year-to-year variation in Resources expenditures results mostly from costs for fighting wildfires.