

Click on any image to see a larger version!

Now there is nothing inherent wrong with this map as it is designed to show the likelihood of a candidate getting Electoral College votes.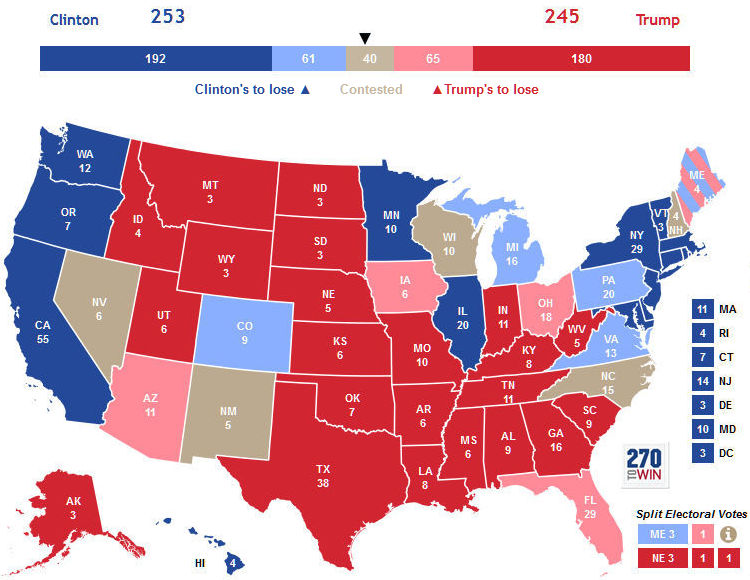
The problem is this mapping method leaves us thinking there are actually Red States and Blue States that are communities of Republicans or Democrats, Conservatives or Liberals.
One way to dispel that kind of thinking is to consider the 2000 Presidential Election actual results by county. Like states, counties do vary in size based on geography and population. Even so there is likely to be a truer sense of "community" at the county level. Watch the 2000 election map below, particularly the "Left Coast" states plus Michigan, Illinois, New York and Pennsylvania. Notice how those deep blues, and reds but particularly the blues, tend to disappear:

So the counties map does not reflect the human distress resulting from the economic collapse that occurred near the end of Bush's term.
But the point here is the colored map.
Let's examine the 2000 results in a few states to get a clearer picture of the truth starting with what we think of as Blue States:


From a geographic perspective, California and New York were "Red States" in the 2000 election.

Let's take a look at another state, Illinois. Al Gore won the state with 55% of the vote. But that darker blue area near the upper right is Cook County/Chicago which represented 39% of the vote. Outside the darker blue blob, George W. Bush received 52% of the vote.
.jpg/410px-PA2000(2).jpg)
In other words, those of us who live in large "Blue States" really derive our "color" from the largest of urban areas, the small blue blobs.
The question for we Blue State Democrats (and "traditional conservative" Republicans) is have we deliberately chosen to ignore what's happened to people in the "Red Counties" in our own states since 2000? Have we chosen to think of the "Red population" as "fly over states" when in fact they are our neighbors in the next county down the highway? If so, did we do that somewhat arrogantly because we disdain their world view?
And in doing so, is this why we are surprised that Donald Trump might win the "Swing States" and the Presidency?
When you look at the 2012 Presidential Election map by county the United States appears far more "Red" than we have allowed ourselves to understand, particularly all three "Left Coast" states - California, Oregon, and Washington - plus Michigan, New York, and Pennsylvania. In other words we have large "Blue" urban cities and then there is rest of the United States in which, as the convincing fictional con man Harold Hill might today note, there are many folks in trouble, even here ...no particularly here... in California:
Click on the 2012 map to see a really large version which may change your perspective on American politics. Because after this election we need to recognize some American issues we've chosen to ignore.
No comments:
Post a Comment