
My favorite pronouncements come in State Controller John Chiang's monthly State General Fund cash flow report. For instance the report for December said:
The economic recovery continues in the Golden State, and is even accelerating past the U.S. in many areas. Still, the failure of the additional $4 billion in revenues to materialize...means that there are still many tough decisions ahead.For January in his report released this week he told us:
January missed the 2011-12 Budget Act’s estimate by an even wider margin, coming in $1.2 billion less than projections....
Year to date, the State is $3.7 billion short of revenues so far....
Outside of the state’s finances, the economy continues to gain steam and has begun to outpace the remainder of the U.S.
So the State's economy is doing well, but it just doesn't show up in Chiang's tax revenue numbers.
 Yeah, right.
Governor Jerry "Moonbeam" Brown's Finance Department put out a two page memo in response to the latest release by Chiang which ...well... I'll just quote it here:
...However, estimated payments in December and January were down over 13 percent. This pattern is very atypical. In fact, a similar pattern has only occurred once in the last twenty years.What is clear is that Moonbeam's Administration has no idea what's going on, but keeps looking in-house for history, ...well... 20 years of history, not even back to Moonbeam's first term... that would offer some explanation. While pushing for his temporary, inadequate revenue tax increase plan that's going to solve all problems, Governor Moonbeam has been running around the state focusing his fawning press on tech industry, which as I've explained here many times doesn't create new jobs, just replaces jobs they eliminated a few years ago and will eliminate again a few years from now.
While concerning, it is not clear what the lower December and January receipts or the atypical pattern of personal income tax receipts in 2011 means for final payments in April, or for the revenue that the state should expect for the 2012 tax year. It is possible that taxpayers did not pay sufficient cash through their estimated payments – as was the case in 2007 — and will make it up with strong final payments in April. Alternatively, it could be that capital gains were lower in 2011 than was forecast. Such a reduction could be the result of taxpayers, because of market conditions in late 2011, delaying their sales of stock from late 2011 into early 2012. If that is the case, the current revenue shortfall could be largely eliminated through strong estimated payments in April and June. However, it is also possible that the capital gains forecast was too high and that the dropoff will not be offset by additional gains in 2012. If this is the case, the capital gains forecast will likely be reduced for 2012 and subsequent years as well. The bottom line is that possible explanations for the lower receipts are numerous, but the actual cause is very uncertain.
The press keeps reporting significant growth in employment. They get this from news releases issued by the California Employment Development Department and the U.S. Department of Labor. The problem is the statistics used for those news releases are based on "household surveys" and the data is "seasonally adjusted".
But they also produce other related statistics. For instance these include an "employer survey" without "seasonal adjustments." And then there are the number of jobs reported by employers in quarterly employee withholding tax forms, a number never reported in the press.
The problem is the surveys and the quarterly employee withholding tax forms don't seem to match as shown in this graph (click on the graph for a larger version):

It's confusing. The seasonally adjusted household survey shows that we have 894,213 fewer jobs than we did in the last quarter of 2007. The unadjusted employer survey shows 1,010,433 fewer jobs than in the last quarter of 2007. And the lying employers show 1,115,108 fewer jobs than in the last quarter of 2007.
But jobs aren't everything to economists, the press, and politicians. We have home sales data, for instance. According to Bloomberg News Sales of Existing U.S. Houses End 2011 on High Note and the California Association of Realtors reported "sales of existing single-family homes in the Golden State posted an annual increase for the sixth straight month in December."
Except what the data means is that more homes actually sold including foreclosure homes. The Standard & Poor's Case–Shiller Home Price Indices for California show the following:

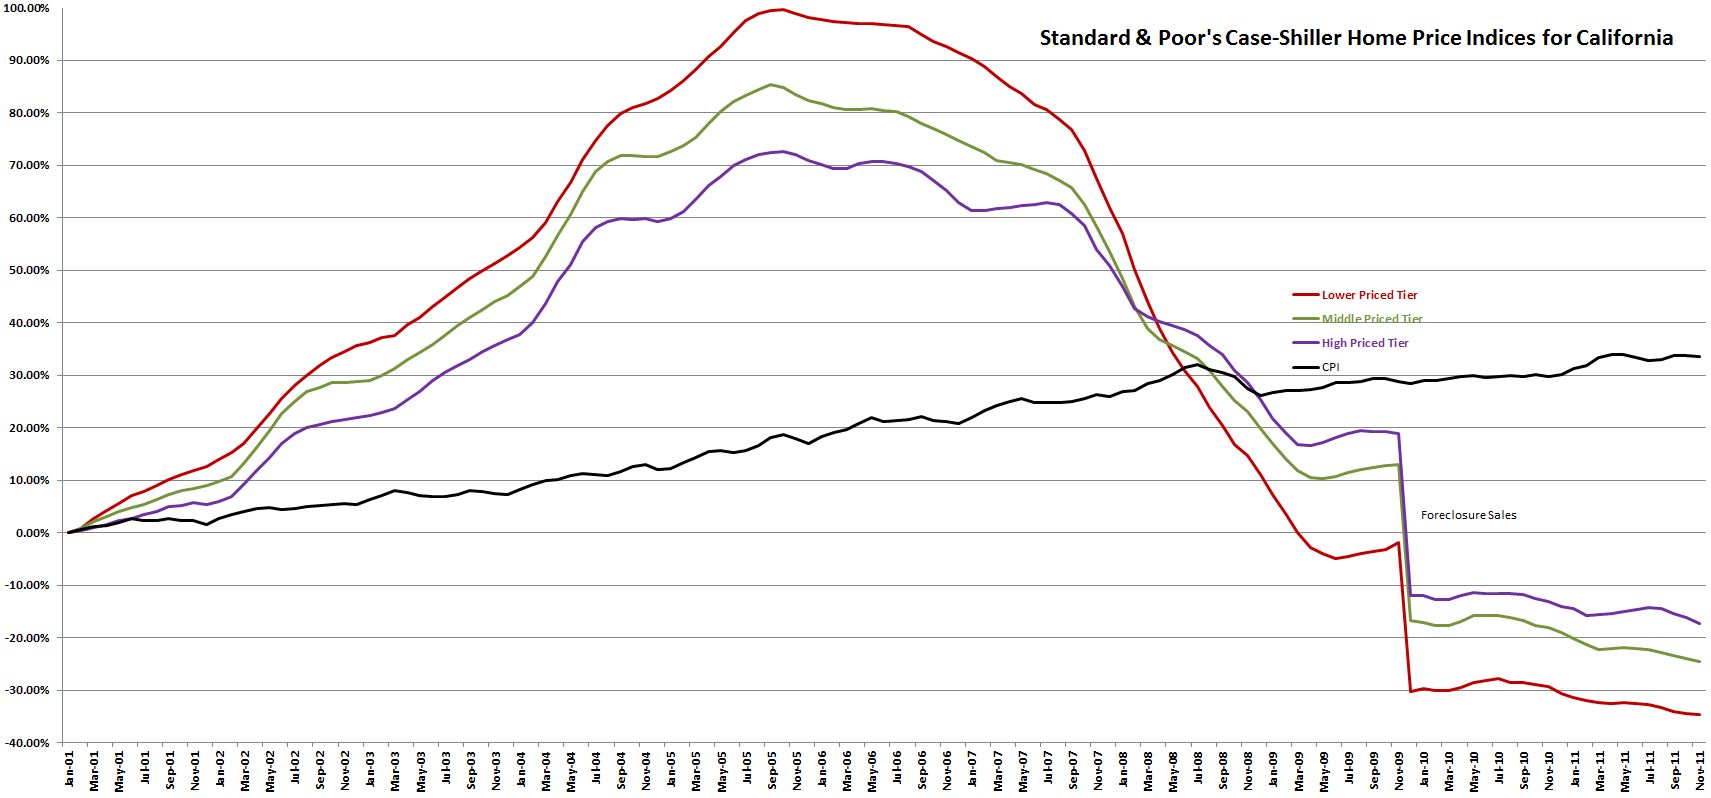
As I've said before, The Great California Slump will continue for many years. Too bad Moonbeam's Finance Department doesn't have the nerve to look outside their files for numbers about the economy. But I suppose if I worked from Moonbeam, I wouldn't do that either.
No comments:
Post a Comment