
Last October in What's the purpose of an "economy" two contrasting definitions of an "economy" were offered:
At Dictionary.com we learn that we can describe an economy as "the management of the resources of a community, country, etc., esp. with a view to its productivity."The difference between these two descriptions is informative. One is about people meeting their material needs - having food, clothing, shelter, medicine, and other "stuff ." The other could be about computers and robots using material resources to increase something called "productivity." Do you ever wonder what purpose our economic growth has served?
On the other hand the folks at Wikipedia [until the middle of December 2009] offered a different definition: "an economy is the ways in which people use their environment to meet their material needs."
Distribution of economic growth since WWII
Here is a chart that reflects the outcome of our economy over the last 63 years (click on the chart to see a larger version):
Chart 1

The chart graphically displays:
- Personal income adjusted for the Consumer Price Index has continued to rise;
- Investment income (dividends and interest) as a percentage share of that income has grown substantially;
- Wage and benefit income as a percentage of that income has shrunk.
Chart 2

This chart graphically illustrates the U.S. economic productivity growth and growth rates of personal income by source. Looking at the period from just after World War II until mid-2010, the Gross Domestic Product after adjusting for inflation and population growth grew 186%. We find that during the same period personal income grew 209%.
One cannot help but notice with concern that wage and salary income has grown only 147% and, more alarming, business proprietors' income - usually small businesses that are single proprietor or partnerships -which has grown only 33%.
Those percentages are in sharp contrast to dividend and interest income has grown 565%, nearly four times that of wage and salary income and nearly 16 times that of proprietor income, confirming what was evident in the first chart, that the post-WWII economic growth pattern benefited:
- Investor income three times the actual economic growth rate;
- Worker-income 20% less than the economic growth rate
- Small business owner income 80% less than the economic growth rate; and
- Landlord (both residential and commercial) income ...well... it appears to have been a roller-coaster ride that ends at a point 50% less than the economic growth rate.
It would appear that the purpose of the American economy for the past 60 years has been to improve the return on money invested in corporations and financial institutions. That necessarily has resulted in a lesser share of income from growth for labor whether that labor was done by employees or by proprietors and partners.
Again, let's take a look at another chart covering the last 63 years (click on the chart to see a bigger version):
Chart 3

From 1947 to today, for each dividend and interest dollar paid to American investors, the amount paid for labor in America dropped from about $9.50 to $4.00.
Before proceeding, two things should be made clear. This is not about "Socialism" which at its core means state ownership of the real estate, machinery, and other means of production. This is not about the recent term "Ownership Society" which is a political slogan meaning different things to different people (but for advocates has generally meant the beginning point of an argument for the reduction in income transfers from the more affluent to the poor imposed by the government).
This post is not about socialism nor the politics of poverty. It is about a long-term economic trend in income distribution from what we like to refer to as our "mixed economy."
Remember the two definitions/descriptions of an "economy" at the beginning of this post? One is about people meeting their material needs. The other could be about computers and robots using resources to increase something called "productivity."
We seem to be doing very well at implementing using resources through automation with the result being increased productivity.
How well have we done in this country if we define "material needs" at its minimum? "Needs" after all means "what is required, necessities." Relative to other developed nations, we do poorly at making certain all our people have access to what is required to maintain a life free of need, meaning a minimum standard of living. We try, but particularly now, in The Great Recession, we're plagued with more homelessness and inadequate health care and we do have more than a few children who do not get "three square meals" a day.
But when Americans talk about the economy, we use a traditional American viewpoint regarding standard of living. When we discuss our needs - "what is required" - we really mean that which is needed to maintain a "middle class" lifestyle. The problem is, nobody seems to clearly know what that is.
What is the "Economic Middle Class"
We think we know what the "economic lower class" is (keep in mind these are not pejorative terms demeaning people, but terms related to income and assets owned). The government defines "poverty level" income for a family of three (usually with one wage earner) as $18,310, though the unspoken assumption (sometimes not true) is that this family would receive in "income transfer payments" in the form of medicaid, food stamps, and a housing subsidy plus training and other assistance to make them more employable.
Then we all need to know who is in the "upper class." Probably the best definition uses the personal net assets level to define the "economic upper class." The Generation-Skipping Transfer Tax Exemption is set at $2 million, a figure which was also the Estate Tax Exemption from 2006 to 2008. If the members of a "nuclear family" have $2 million in net assets (assets less liabilities), by American government standards they are in the economic upper class.
It seems therefore that the American "economic middle class" is a vast number of people who find themselves outside what the government defines as the economic lower class (whew!) and the economic upper class (darned!).
But defining the "economic middle class" this way is very confusing as there are substantial variations in the "lifestyles" within this group of American. Is there one guideline Americans have used as an indicator of "middle-classness?" Probably having sufficient income to buy a home is an indicator of achievement to middle class. (Home ownership itself is not an indicator, just having sufficient income to buy a home if one wishes to do so is the indicator that a family has achieved the shared American dream.)
According to the California Association of Realtors, in the first quarter of 2007 the minimum household income needed to purchase an entry-level home in California was $96,910. By the third quarter of 2009 - after the housing price bubble burst leading to The Great Recession - the minimum income needed to buy an entry-level home in California was $43,500.
There seems to be a huge difference between these numbers. Do you need to earn $97,000 a year or $43,500 a year to reach achievement to middle class? The home price bubble really did a number on "middleclassness" in California and in many urban areas across the nation during the last decade. Fortunately, in much of the nation the numbers averaged half the California numbers from 1990 - 2007.
If we assume that in 2010 a wage-based income of around $45,000 a year is the indicator of arrival to middle class, then what about those with incomes between $18,310±($9/hr) and $45,000± ($22/hour). Historically this group would have been called the "working class" and "blue collar workers." Also historically, people above this level were proprietors (business owners) and professionals (attorneys, doctors, etc.), people who invested in, and owned the assets of, their businesses and were more likely to be called the middle class.
As we have seen in Chart 2 above, "proprietors" who own their businesses have become fewer and likely are seeing less personal income. In fact, during the past 60 years more of these Americans have become employees in medical groups like Kaiser or a corporate attorney or a manager of a business division of a large corporations. They don't own their business.
One confusion about the middle class here in the beginning of the 21st Century is identity. Employment including such diverse groups as academics and teachers, social workers, engineers, managers, doctors, nurses, pharmacists, and attorneys have been defined as "professional-managerial class." Barbara and John Ehrenreich formally described this group as "salaried mental workers who do not own the means of production and whose major function in the social division of labor...(is)...the reproduction of capitalist culture and capitalist class relations."
Though self-described as "middle class," those in the professional-managerial class tend to seek higher rank status and have higher incomes than average for factory, clerical and service workers. In the latter part of the 20th Century members of the professional-managerial class came to identify themselves with those in families whose income derives primarily from dividends and interest.
Thus, by the early 21st Century these mostly college-educated workers erroneously identified their interests with the interests of the economic upper class. This may have happened because in their nuclear families, through the advent of having two wage earners in the household and access to essentially unlimited debt, many of them acquired gross assets valued in excess of $1 million, though the asset value was inflated by the housing bubble, their net assets were well below that number, and their income derived mostly from work.
Dreams notwithstanding, if (a) you must earn wages or a salary to maintain your standard of living, (b) your income exceeds $20,000±, and (c) your assets minus debts total less than $2 million, you are in the working middle class whether you are a single parent family with an income of $30,000 a year living in a rental or a single child working couple with a family income of $110,000 a year living in your owned home. Today the vast majority of Americans who are working are in the middle class.
The median weekly earnings for full time employment is $740 a week or $38,480 a year or $18.50 per hour which means that most of single person or single parent American middle class families could not feel like they've achieved "middle-classness," meaning they could not buy a home if they wished to do so.
As a subgroup the median weekly earnings for full time employment for those in the professional-managerial class is $1,050 a week, $54,600 a year, or $26.25 an hour. As a subgroup, single person or single parent professional-managerial class families need only one person employed to feel like they've achieved "middle-classness" meaning they could buy a home (though not in California in during the mid-2000's where two such incomes were required).
We've explored the idea of "middle-classness." Let's return now to the economy.
Returning to business as usual
According to Treasury Secretary Timothy Geithner in an August 2nd New York Times op-ed piece the economy is returning, even if it is doing so slowly. He lists a number of things that indicate a basis for optimism to him and other financial types including:
• Exports are booming because American companies are very competitive and lead the world in many high-tech industries.The problem with this list is that it does represent a return to the economy that began with second half of the 20th Century. No one has bothered to ask the question "Is this what our economy is supposed to do?" Let's take these items one at a time and examine them from an American middle class viewpoint.
• Private job growth has returned — not as fast as we would like, but at an earlier stage of this recovery than in the last two recoveries. Manufacturing has generated 136,000 new jobs in the past six months.
• Businesses have repaired their balance sheets and are now in a strong financial position to reinvest and grow.
• The auto industry is coming back, and the Big Three — Chrysler, Ford and General Motors — are now leaner, generating profits despite lower annual sales.
High-tech Industry Exports. As explained here last October in the post The iPad Economy we see growth in our GDP when Apple sells iPads to customers in Germany. The product is manufactured in China a shipped to Germany and Apple shareholders will make money. From that economic activity, few American workers will benefit, limited mostly to those in the "professional-managerial class"though a small number of support, clerical and janitorial folks will see continued employment.
But this technological export growth will not produce in the United States any manufacturing jobs and probably no other new jobs.
Private Job Growth. My reaction was "you've got to be kidding." According to recent statistics from the government that employs Geithner, so far during The Great Recession the U.S. lost about 7.3 million jobs while the workforce grew 0.7 million. We need 8 million jobs just to rebuild our economy where it was in November 2007. Any growth in recent months is negligible, barely keeping pace with the current growth in the workforce.
Then, particularly since he is a member of a Democratic Administration, one has to wonder under what rock Geithner has been living during recent decades that he would mention "manufacturing jobs." Since 1977 - 32 years ago - the United States has lost 7.5 million manufacturing jobs - yes, nearly 2 million of those were among the 8 million jobs lost in The Great Recession. But without a substantive change in dominant attitude among the financial gurus and those in the upper-most tier of the managerial class, we're not going to see even those 2 million manufacturing jobs come back in the next decade. This is a graph of our manufacturing employment since 1947:
Chart 4
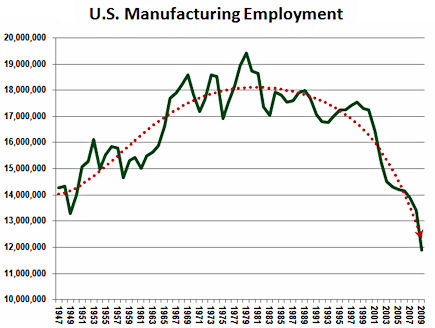 Manufacturing jobs, really? Even if manufacturing employment in America could recover to 2007 next year, we'd still be short 6 million jobs. But where are these manufacturing jobs going to come from? Green industry? Which brings us to his next item.
New Investment Resulting from Repaired Business Balance Sheets. Which businesses? Big international corporations like GE are using the asset accumulation in the balance sheet to pay dividends to their shareholders and buy back their own stock in order to increase the stock value. We'll explore this asset use later in this post, but GE is a major manufacturer of alternative energy systems.
Large retailers? Are they planning new investment? Most retail sales depend entirely on American worker income. Costco, Home Depot, Walmart and Safeway all are ready to invest? In what? New stores???
High tech manufacturing? Yeah, a new plant opened in Taiwan to manufacture new iPads.
For a even clearer picture, let's move on to the next item.
The American Auto Industry Rebound. That the American auto industry is showing a rebound is true. Ford is the best example. Last month it reported a $2.6 billion second quarter profit, which is nearly 70% of it highest profits ever in 1999. It is doing it with half the employees it had back then.
General Motors. You remember them. The government bail-out left the taxpayers owning 60% of GM. It appears GM is going to be making a pile of money - in China. GM sells more cars in China than it does in the U.S. and produces them there. It employs 32,000 hourly workers in China and 52,000 in the United States. It employed 470,000 here in 1970.
And, if you're among the corporate professional-managerial class, such as an engineer on the electrical system in the Volt, you need to be aware that GM in China is building a $250 million advanced technology center to develop batteries and alternative energy sources (that green industry the President is suggesting might put Americans to work). Maybe we can still buy a 2021 Chevy Volt assembled here by robots, but the improved batteries in that year's model will have been developed and probably manufactured in China, by Chinese engineers and Chinese workers.
Fortunately, the American taxpayer will share in the profits if GM succeeds in China. Of course if you have been unemployed or are making half what you made in 2006, you won't share much. But those who depend on dividends and interest for income likely will see some benefit from those profits if only in the form of lower income taxes.
To repeat a previous paragraph: From 1947 to today, for each dividend and interest dollar paid to Americans, the amount paid for labor in America dropped from about $9.50 to $4.00. Is this the desired purpose of an economy?
What do we want from our economy?
What do you as an American want from the American economy? As indicated in Chart 3, at the beginning of 1952 ten dollars ($10.00) was paid to Americans in wages and benefits for each dollar of interest and dividends paid to Americans. By 2006 that number had dropped to four dollars ($4.00) where it has hovered since.
For nearly 60 years, we have rewarded capital investment with a larger share of income from economic growth than the share we rewarded labor. If the trend for American capital to invest in automation and in industrial/technological production in foreign nations continues, this shift in reward pattern will continue. If these trends continue, wages and benefits paid to Americans workers for each dollar of interest and dividends paid to American investors will drop to $1.60 by the end of the Century.
This investment pattern is not inherently bad. But do we want to see the same pattern of reward from American economic growth in the next few decades? Will that pattern depress the American retail and service economy further? Could it create a difference in classes similar to that seen in Third World countries today?
Maybe its all a perfectly acceptable pattern. But if not, the question is how to reconcile this investment pattern with a goal of maintaining both a minimum middle-class standard of living for the poorest among our population and a middle-class homeowner standard of living for most of our population.
One thing is for certain. No problem will arise in increasing the share for the American investor whose income comes wholly from interest and dividends.
Geithner in his Times piece concludes:
And as the president said last week, no one should bet against the American worker, American business and American ingenuity.What he and the rest of the financial community need to address is the fact that no one ever bet against the American worker, American business, and American ingenuity. It is simply a fact that like the auto industry, international corporations headquartered in America using typical American ingenuity are just choosing not to bet on the American worker at this time, but rather on automation and markets in other nations.
We suffered a terrible blow, but we are coming back.
Ford is already a winner using automation, which makes a very large number of potential American auto workers not winners. GM is already a winner in China using Chinese workers and intends to be a winner there in alternative energy using Chinese workers.
The second quarter profit reports indicate that the 500 largest non-financial firms, after watching profits plummet in The Great Recession, have recovered to nearly 90% of pre-recession levels. Their managers are sitting on about a trillion dollars.
The managers know that profit growth is coming from their overseas operations where they are expanding. They know that future profit growth from U.S. operations will come from investment in automation. And they know it is in their best interest to use some of that cash to pay higher dividends and buy back shares to buttress increased share prices until that new investment in automation and in overseas operations pays off.
That's why in a July 23rd article we read:
General Electric Co., emerging from the global recession with a hoard of cash, raised its quarterly dividend by 20 percent and will resume stock buybacks sooner than it had predicted. The shares rose.The Friday prior to the announcement, GE shares closed at $14.55. The price of GE shares rose steadily from then on. Ten days later they closed 13% higher at $16.48.
GE said in a statement it raised the per-share payout to 12 cents a quarter from 10 cents. The company extended stock repurchases through 2013 from the end of this year, and plans to begin buying shares this quarter.
Chief Executive Officer Jeffrey Immelt is scaling back some of the cash-saving steps he adopted in 2008 as the financial crisis deepened. GE said July 16 that it expects to have $25 billion in cash at the parent company level by year-end.
“We are able to restore the GE dividend at a historical payout level for 2010 earlier than previously anticipated and to extend our share buyback program because of continued strong cash generation, recovery at GE Capital, and solid underlying performance in our industrial businesses through the first half of 2010,” Immelt said in the statement.
Not that these companies won't start hiring American workers. They just won't be replacing the 2 million jobs lost in The Great Recession any time soon. Now would be a good time to examine economic growth reward patterns in order to make adjustments for the next 60 years.
Perhaps we'll need to find a way for all members of the American middle class to receive a larger share of the dividend and interest income from economic growth without having to risk their kids' college education, their own future retirement income, and their homes in the process.
No comments:
Post a Comment